

UNLEASH MAX YIELD PROTECTION
With Cleaner & Greener Fungicides
This season, put the odds in YOUR favor. With DUAL yield protection from disease and stress, Cleaner & Greener fungicides help provide MAX yield potential and MAX return ($$$) no matter the season.
Scroll to see how Cleaner & Greener fungicides consistently help deliver positive yield results year over year, under wet AND dry conditions.
Need a Quick Refresh on Cleaner & Greener? Recap Here!
Wet or Dry Year? Doesn’t Matter.
With a portfolio of fungicides like Miravis® Ace, Miravis Neo, Miravis Top and Trivapro® on your side, you can expect higher potential yield and ROI than ordinary fungicides.
How?
The consistent performance of ADEPIDYN® and SOLATENOL® technologies help Cleaner & Greener fungicides deliver reliable results, EVEN when Mother Nature is inconsistent.
Click the Tabs Below to View Your State’s Data by Crop
Cleaner & Greener Fungicides CONSISTENTLY Boost Corn Bushels


| Wisconsin (N=33) | ||||
|---|---|---|---|---|
| 2018 n=2 |
2019 n=5 |
2020 n=11 |
2021 n=7 |
2022 n=8 |
| 16 bu/A | 13 bu/A | 15 bu/A | 20 bu/A | 19 bu/A |
| Kansas (N=35) | ||
|---|---|---|
| 2019 n=16 |
2020 n=11 |
2021 n=8 |
| 13 bu/A | 9 bu/A | 4 bu/A |
| Ohio (N=17) | ||
|---|---|---|
| 2019 n=2 |
2020 n=13 |
2022 n=2 |
| 17 bu/A | 8 bu/A | 44 bu/A |
| Illinois (N=95) | ||||
|---|---|---|---|---|
| 2018 n=3 |
2019 n=17 |
2020 n=33 |
2021 n=35 |
2022 n=7 |
| 17 bu/A | 12 bu/A | 19 bu/A | 21 bu/A | 16 bu/A |
| Minnesota (N=140) | |||
|---|---|---|---|
| 2019 n=45 |
2020 n=57 |
2021 n=24 |
2022 n=14 |
| 9 bu/A | 9 bu/A | 11 bu/A | 34 bu/A |
| Missouri (N=12) | |||
|---|---|---|---|
| 2019 n=6 |
2020 n=4 |
2021 n=1 |
2022 n=1 |
| 23 bu/A | 16 bu/A | 10 bu/A | 7 bu/A |
| Indiana (n=16) | ||
|---|---|---|
| 2018 n=1 |
2020 n=6 |
2021 n=9 |
| 21 bu/A | 18 bu/A | 19 bu/A |
| Arkansas (n=23) | ||
|---|---|---|
| 2020 n=11 |
2021 n=6 |
2022 n=6 |
| 18 bu/A | 12 bu/A | 17 bu/A |
| Iowa (n=104) | |
|---|---|
| 2019 n=102 |
2020 n=2 |
| 9 bu/A | 16 bu/A |
| South Dakota (N=63) | ||
|---|---|---|
| 2019 n=24 |
2020 n=26 |
2021 n=13 |
| 10 bu/A | 10 bu/A | 6 bu/A |
| Nebraska (n=9) | |
|---|---|
| 2019 n=3 |
2020 n=6 |
| 13 bu/A | 12 bu/A |
| All States (N=547)* | ||||
|---|---|---|---|---|
| 2018 n=6 |
2019 n=220 |
2020 n=180 |
2021 n=103 |
2022 n=38 |
| 17 bu/A | 11 bu/A | 13 bu/A | 14 bu/A | 25 bu/A |
*Trivapro (n=311), Miravis Neo (n=236)
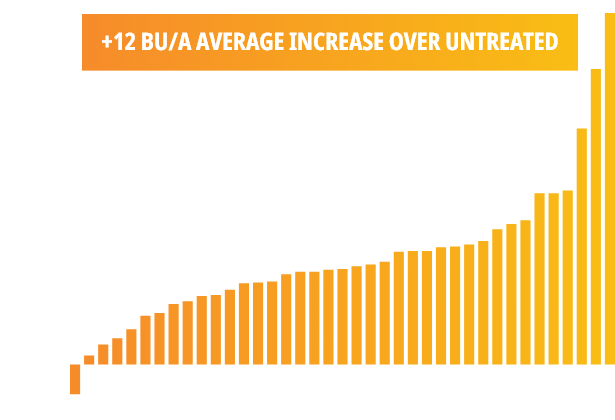
IN FACT, year over year data shows ~80% of applications with a Cleaner & Greener fungicide are profitable, and 30% of the time they delivered 20 bu/A or more, putting the odds even more in your favor.
Average Yield Over Untreated


What Do Plant-Health Savings Really Look Like?
Check This Yield Out!


Berlin, WI; 2020


Keo, AR; 2020. Treatments applied at R1. Diseases present: Moderate Southern rust. Photo taken 8/18, harvested on 10/5.


Want to Run the Numbers?
Calculate the real-world impact Cleaner & Greener fungicides could make on your operation and see the potential GREEN ($$$) for yourself. Or, talk to your retailer about putting Cleaner & Greener to the test in your fields.
See My ROI Potential